

With both traditional stocks and cryptocurrencies seeing steep price declines in the last 36 hours, an article recently written by Marc Howard caught my eye. In “How I Created a Bitcoin Trading Algorithm Using Sentiment Analysis With a 29% Return,” Howard provides a breakdown of how he built the bot.
Using Google Trends, he obtained the data for the preceding 90 days for the terms “BTC USD” and “buy bitcoin.”
Historically, cryptocurrencies have been much more volatile than traditional stocks, and Howard was hoping to use this to his advantage with readily available data from Google. He surmised that if people were searching for terms like “buy bitcoin” and “BTC USD” that market sentiment was good and the price of bitcoin was likely to rise, even from day to day.
He combined this with an analysis of the price of bitcoin over the same 90-day period and set about building the bot with Excel. The results suggested that when the price had risen by more than $80 on the previous day and the ratio of the two terms “buy bitcoin” to “BTC USD” was more than 35%, it would be prudent to place a buy order and conversely sell when the opposite was true.
Using Google Trends
As Howard points out in the article, some of the parameters used, like the prior day price increase of $80, were fairly arbitrary so we thought we would verify the results and consider possible improvements for the bot.
Howard had produced a paper gain of 29% over the 90 day period which compares favorably with a break even from either a daily buy and sell or HODL throughout the period.
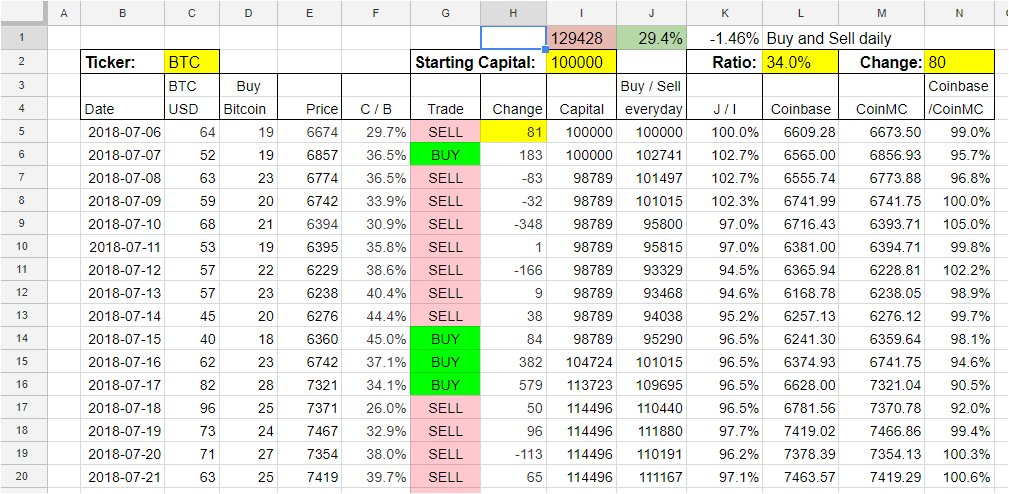
We built the Google Sheet above, which is available for download as a local Excel file, and it contains two worksheets, “Marc Howard” and “MoneyMakers”. The “MoneyMakers” worksheet was created before we contacted Howard with our findings, and rather than use the average daily closing price for bitcoin we used the Coinbase closing price.
This was done on the basis that an average price is simply that, an average and an actual exchange price would be closer to reality. Coinbase is one of the biggest exchanges in the US, and we were able to pick up the closing prices with an API whereas Howard manually entered the average closing prices.
In addition to the variances between Coinbase closing prices and average closing prices, we noticed that the Google Trends data in the original report produced by Howard was different from the data we had obtained.
In some cases, the difference was relatively small, but on other days it was quite significant. A Google search confirmed that Google Trends data does vary and even modifying our IP address to various geographical locations didn’t help.
Trading Bot Design
As shown in the screenshot above, we were able to validate the results of a 29% return over the 90-day period by using identical data to Howard. Unfortunately, the bot is quite sensitive to small variances in the input data and using a similar methodology on the Coinbase exchange and accepting variances in Google Trends data would have given a break-even return.
One major weakness in the original design of the bot, as highlighted by Vikram Urun, is that Google Trends doesn’t provide real-time data and is generally two days old, thus rendering the bot unusable.
Howard is looking to enhance the bot in due course and acknowledged the time lag with Google Trends. As a workaround he suggested:
“to change the timespan to Hourly then you can aggregate to a daily metric.“
We commend the work carried out by Marc Howard and look forward to seeing his further iterations of the trading bot.
Featured image from Shutterstock.