
KOM Analytics turns scattered reports into a shared picture
KOM Analytics builds connected reporting for small and midsize organizations whose financial and operating information sits in different systems. Its proposition is to bring existing reports and data together so teams can work from a shared picture. That approach could appeal to organizations that need better visibility but are reluctant to replace the software they already use.
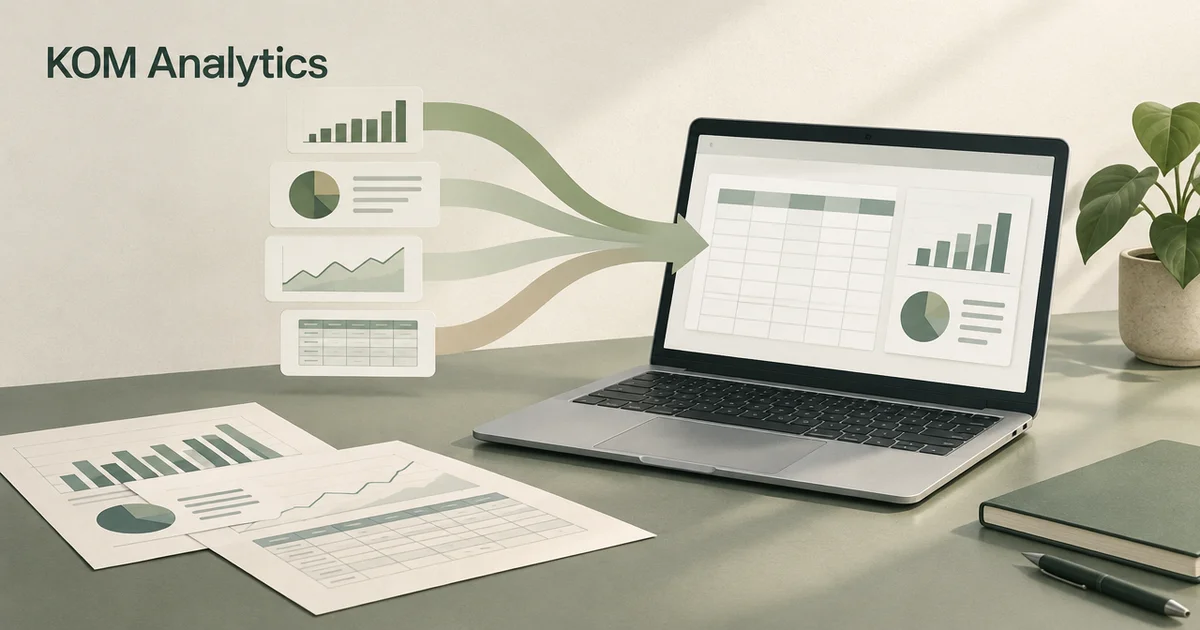
Making existing data useful
KOM says one small manufacturer was manually combining reports for inventory, sales and cash flow. It connected the customer’s existing business-management database and used Power BI to create a dashboard, while the manufacturer kept its existing system and team.
The case illustrates the sales proposition: a buyer can seek more useful reporting from information it already collects, rather than starting with a wholesale system replacement.
A healthcare application
In a separate anonymized account, KOM says it combined scheduled financial reports from Sage with revenue reports from PointClickCare for a senior-living community. The resulting reporting let leaders examine figures by location and payer.
KOM also offers a healthcare scorecard covering federal CMS metrics, alongside reporting on patient census and payer revenue mix.